Statistical note
Normality and goodness-of-fit diagnostics
Shapiro–Wilk, D’Agostino–Pearson, Anderson–Darling, Q–Q thinking, and why testing normality is not a checkbox.
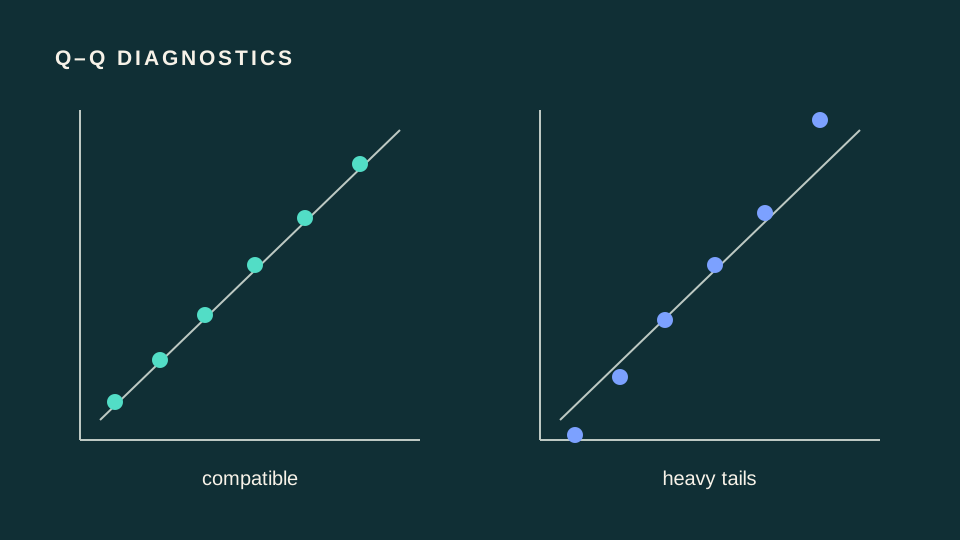
Normality tests evaluate compatibility with a normal distribution; they do not certify that a downstream model is correct. Shapiro–Wilk uses a correlation-like comparison between ordered observations and expected normal order statistics.
import numpy as np
from scipy import stats

residuals = np.array([-1.2, -0.7, -0.2, 0.0, 0.1, 0.4, 0.8, 1.1])
print(stats.shapiro(residuals))
print(stats.normaltest(residuals))       # requires a sufficient sample size
print(stats.anderson(residuals, dist="norm"))
Mathematics and interpretation
A goodness-of-fit statistic measures a discrepancy between the empirical distribution and a reference . Different tests weight the center and tails differently. A p-value answers how surprising that discrepancy is under the fitted null procedure.
Case study: model residuals
For cell-intensity regression, inspect residual Q–Q structure, residuals versus fitted values, and clusters by experiment. At large , tiny harmless deviations can be significant; at small , damaging departures can be undetected. The relevant question is whether inference is robust to the observed departure.
Functions: scipy.stats.shapiro, normaltest, anderson, cramervonmises, and goodness_of_fit.
The normal model is commonly written as
Continue through the concepts
Related notes
 What makes a statistical method parametric?
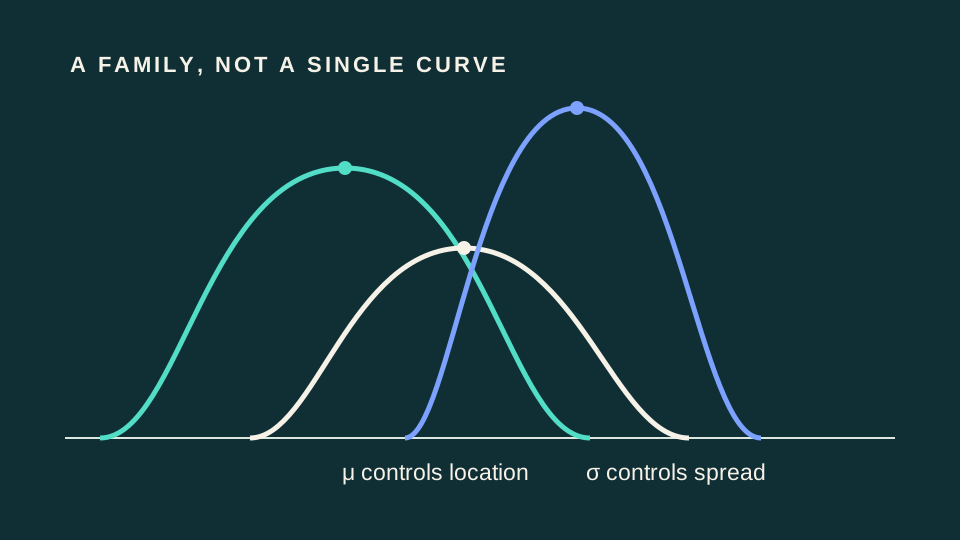
Understanding parameters, distributional models, assumptions, and why parametric does not simply mean normal.
 Descriptive and robust statistics with SciPy
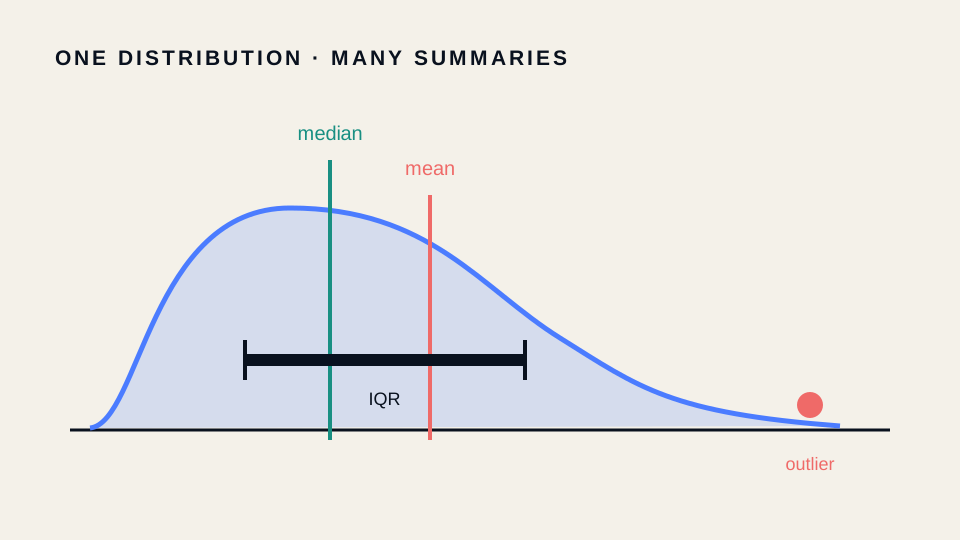
Mean, median, variance, IQR, MAD, skewness, and kurtosis: what each summary measures and when it can mislead.
 Correlation: Pearson, Spearman, and Kendall
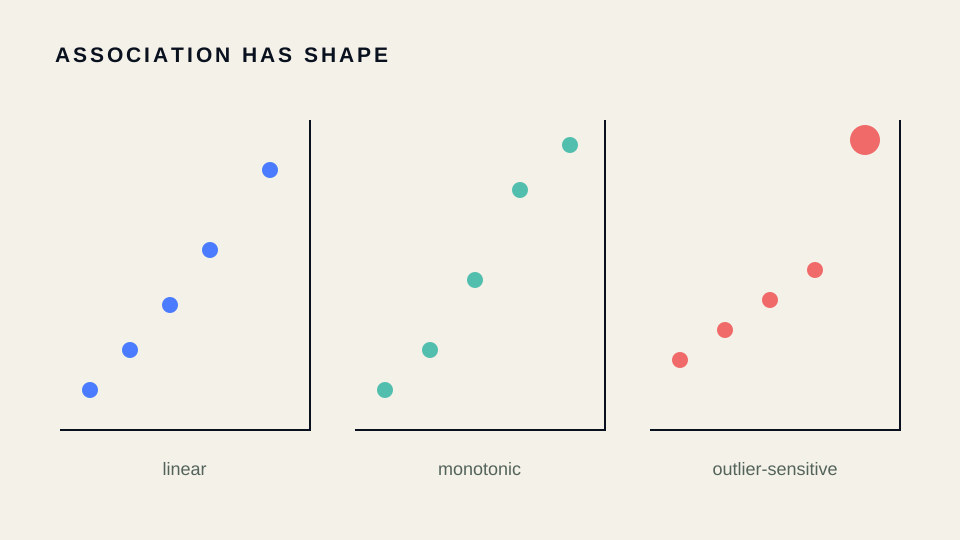
Linear, monotonic, and concordance-based association, with confidence intervals and microscopy examples.
 Comparing more than two groups
ANOVA, Welch ANOVA, Kruskal–Wallis, and Friedman tests with assumptions, effect decomposition, and post-hoc cautions.