Statistical note
Descriptive and robust statistics with SciPy
Mean, median, variance, IQR, MAD, skewness, and kurtosis: what each summary measures and when it can mislead.
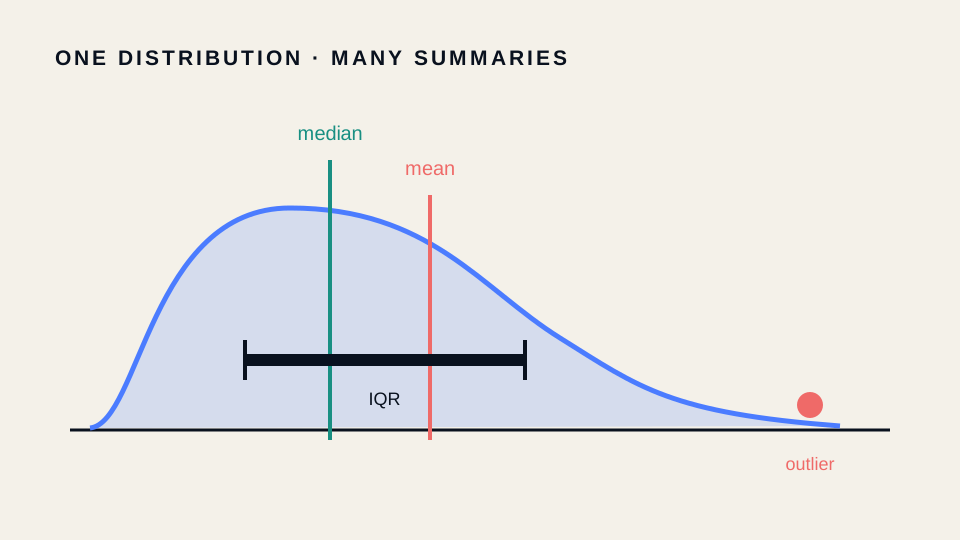
Summary statistics compress a distribution, but each compression preserves different information. For observations , the arithmetic mean is
while the sample variance is
Robust alternatives
The median resists isolated extreme values. The interquartile range is . The median absolute deviation is ; multiplying by approximately makes it comparable to the standard deviation under normality.
import numpy as np
from scipy import stats

area = np.array([42, 45, 46, 48, 51, 53, 55, 58, 190])
summary = stats.describe(area)
print(summary.mean, np.median(area))
print(stats.iqr(area), stats.median_abs_deviation(area, scale="normal"))
print(stats.skew(area, bias=False), stats.kurtosis(area, bias=False))
Case study: segmented cell area
One merged segmentation can make the mean cell area jump while the median changes little. Report a distribution plot and robust summaries before interpreting a treatment effect. Skewness describes asymmetry; kurtosis describes tail weight relative to a reference convention, not simply “peakedness.”
Functions: scipy.stats.describe, iqr, median_abs_deviation, skew, and kurtosis.
Continue through the concepts
Related notes
 Huber and Tukey loss functions
A reference-level guide to huber and tukey loss functions: theory, assumptions, diagnostics, worked bioimaging analysis, exercises, and reporting.
Least-median and least-trimmed squaresA reference-level guide to least-median and least-trimmed squares: theory, assumptions, diagnostics, worked bioimaging analysis, exercises, and reporting.
M-estimation and robust regressionA reference-level guide to m-estimation and robust regression: theory, assumptions, diagnostics, worked bioimaging analysis, exercises, and reporting.
Quantile regressionA reference-level guide to quantile regression: theory, assumptions, diagnostics, worked bioimaging analysis, exercises, and reporting.