Statistical note
Correlation: Pearson, Spearman, and Kendall
Linear, monotonic, and concordance-based association, with confidence intervals and microscopy examples.
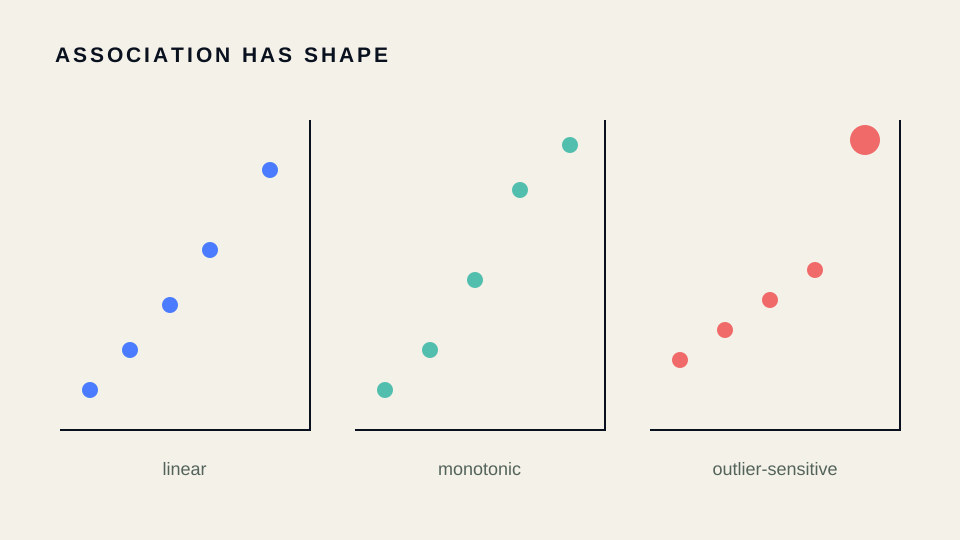
Pearson’s coefficient measures linear association:
Spearman’s applies Pearson correlation to ranks; Kendall’s compares concordant and discordant pairs.
from scipy import stats

phase_mass = [11, 14, 18, 22, 27, 31]
fluorescence = [8, 12, 17, 21, 26, 35]

pearson = stats.pearsonr(phase_mass, fluorescence)
print(pearson.statistic, pearson.pvalue, pearson.confidence_interval())
print(stats.spearmanr(phase_mass, fluorescence))
print(stats.kendalltau(phase_mass, fluorescence))
Case study: QPI and fluorescence
Correlating dry mass with fluorescence per cell can reveal association, but cells nested within fields violate ordinary independence. Correlation does not establish agreement, calibration, or causality. Plot the relationship, inspect nonlinear structure and influential points, and consider hierarchical modelling.
Functions: scipy.stats.pearsonr, spearmanr, and kendalltau.
Continue through the concepts
Related notes
 Descriptive and robust statistics with SciPy
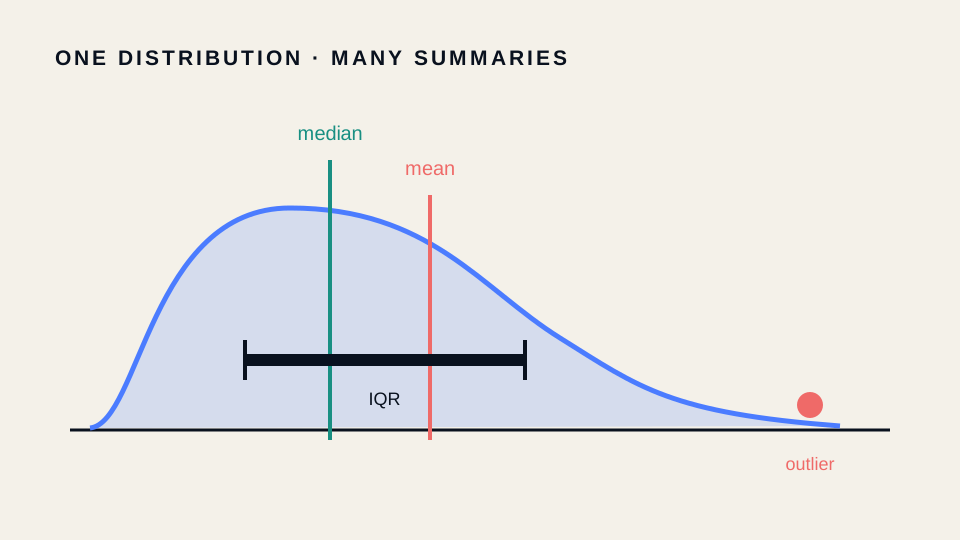
Mean, median, variance, IQR, MAD, skewness, and kurtosis: what each summary measures and when it can mislead.
 Normality and goodness-of-fit diagnostics
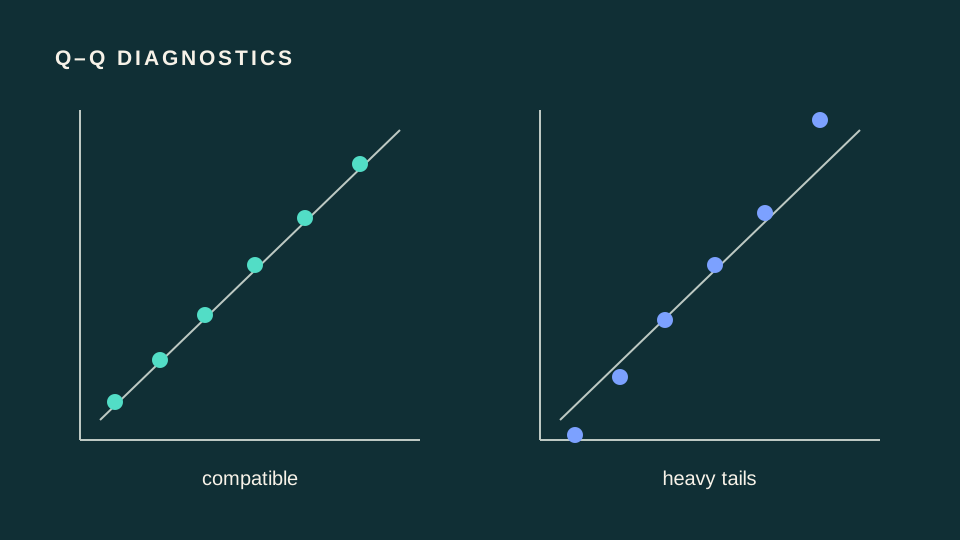
Shapiro–Wilk, D’Agostino–Pearson, Anderson–Darling, Q–Q thinking, and why testing normality is not a checkbox.
 Comparing more than two groups
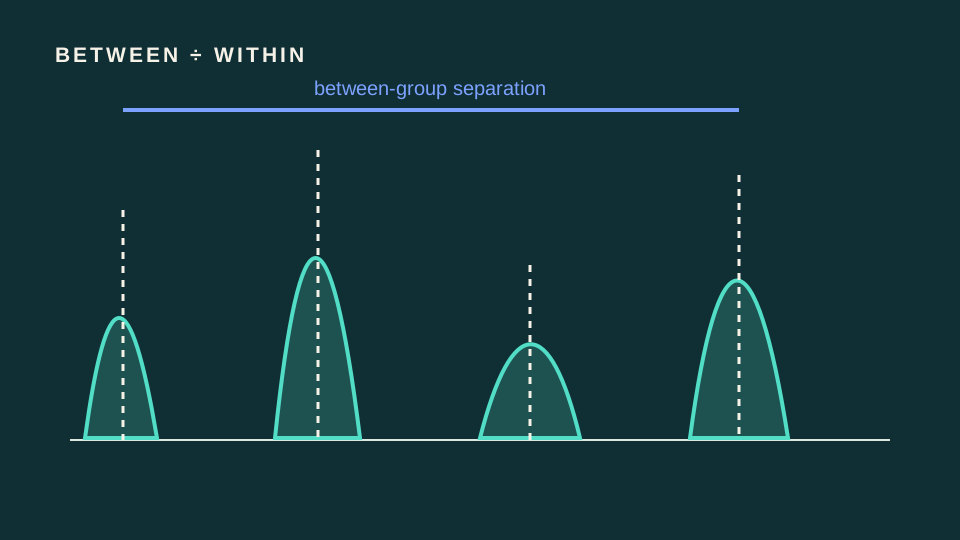
ANOVA, Welch ANOVA, Kruskal–Wallis, and Friedman tests with assumptions, effect decomposition, and post-hoc cautions.
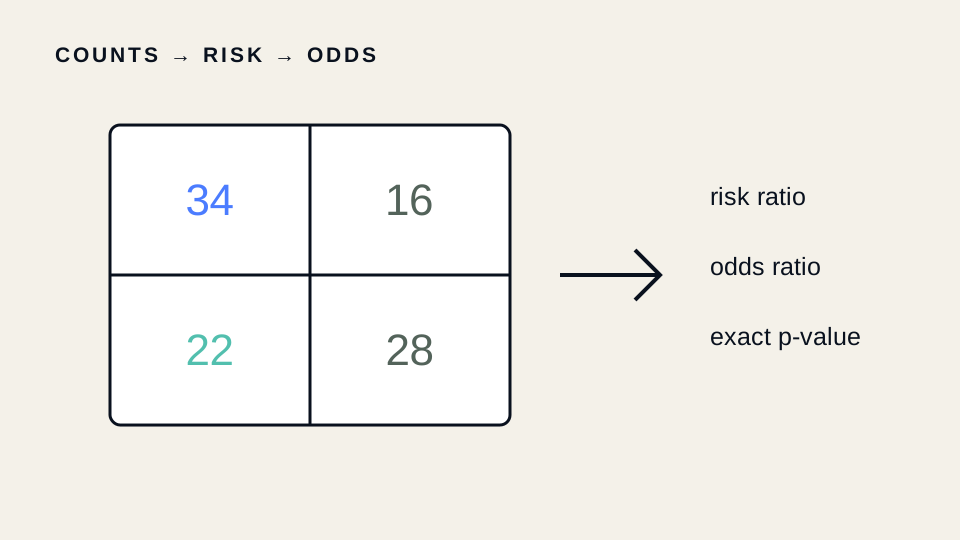 Contingency tables, risk, and exact tests
Chi-square independence, Fisher’s exact test, odds ratios, relative risk, and cell-count case studies.