Statistical note
Contingency tables, risk, and exact tests
Chi-square independence, Fisher’s exact test, odds ratios, relative risk, and cell-count case studies.
For counts in a contingency table, independence implies expected counts
and Pearson’s statistic is .
import numpy as np
from scipy import stats
from scipy.stats.contingency import odds_ratio, relative_risk

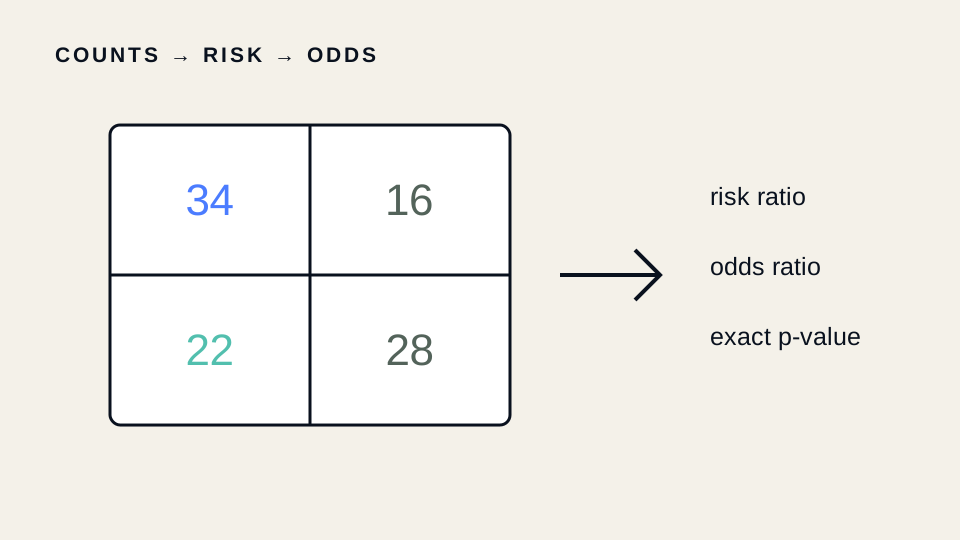
table = np.array([[34, 16], [22, 28]])  # rows: treatment/control; cols: bound/unbound
print(stats.chi2_contingency(table))
print(stats.fisher_exact(table))
print(odds_ratio(table).statistic)
print(relative_risk(34, 50, 22, 50).relative_risk)
Case study: bacteriophage binding
The risk ratio compares binding probabilities; the odds ratio compares odds. They are not interchangeable when outcomes are common. Fisher’s exact test is useful for sparse tables; chi-square approximations require adequate expected counts.
The experimental unit remains the biological replicate, not every detected particle if particles share an acquisition context.
Functions: scipy.stats.chi2_contingency, fisher_exact, barnard_exact, boschloo_exact, odds_ratio, and relative_risk.
Continue through the concepts
Related notes
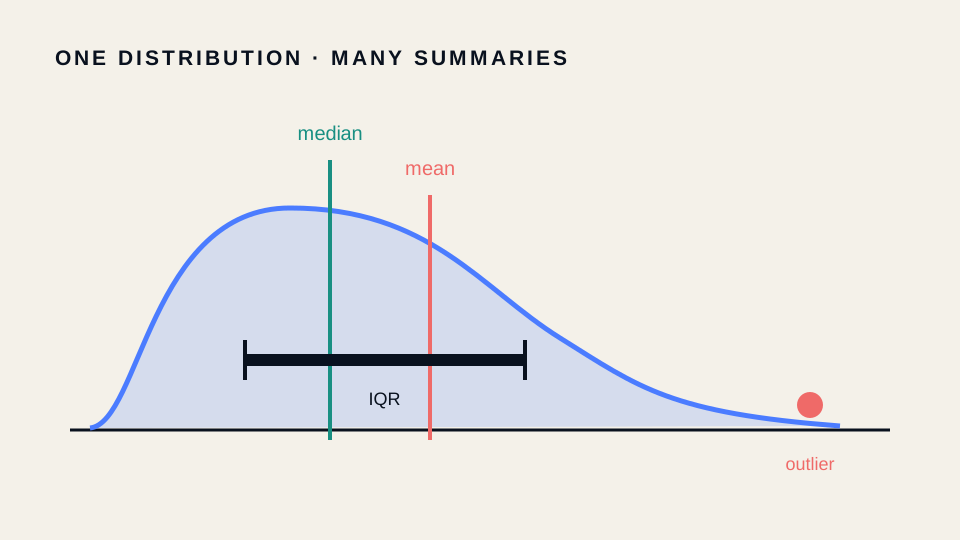 Descriptive and robust statistics with SciPy
Mean, median, variance, IQR, MAD, skewness, and kurtosis: what each summary measures and when it can mislead.
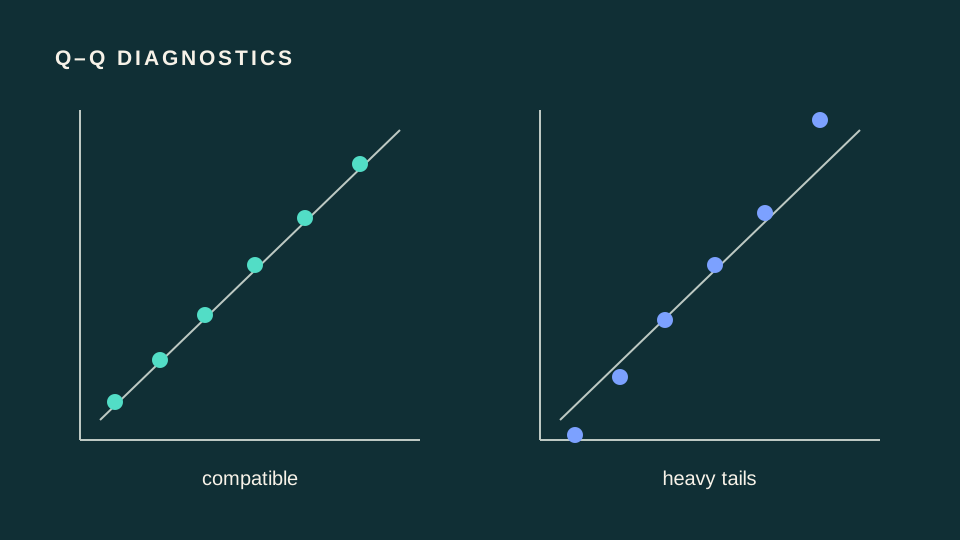 Normality and goodness-of-fit diagnostics
Shapiro–Wilk, D’Agostino–Pearson, Anderson–Darling, Q–Q thinking, and why testing normality is not a checkbox.
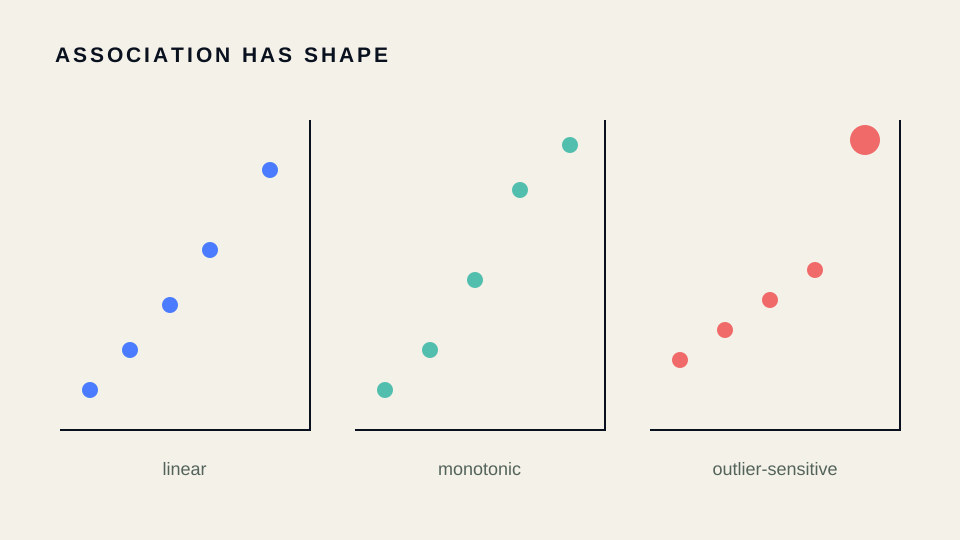 Correlation: Pearson, Spearman, and Kendall
Linear, monotonic, and concordance-based association, with confidence intervals and microscopy examples.
 Comparing more than two groups
ANOVA, Welch ANOVA, Kruskal–Wallis, and Friedman tests with assumptions, effect decomposition, and post-hoc cautions.