Statistical note
Selection bias and representativeness
Recognise when inclusion, exclusion, survival, or visibility mechanisms distort the analysed sample.
Does the design create independent, comparable observations that support the intended scientific claim? This note turns that question into a practical analysis workflow.
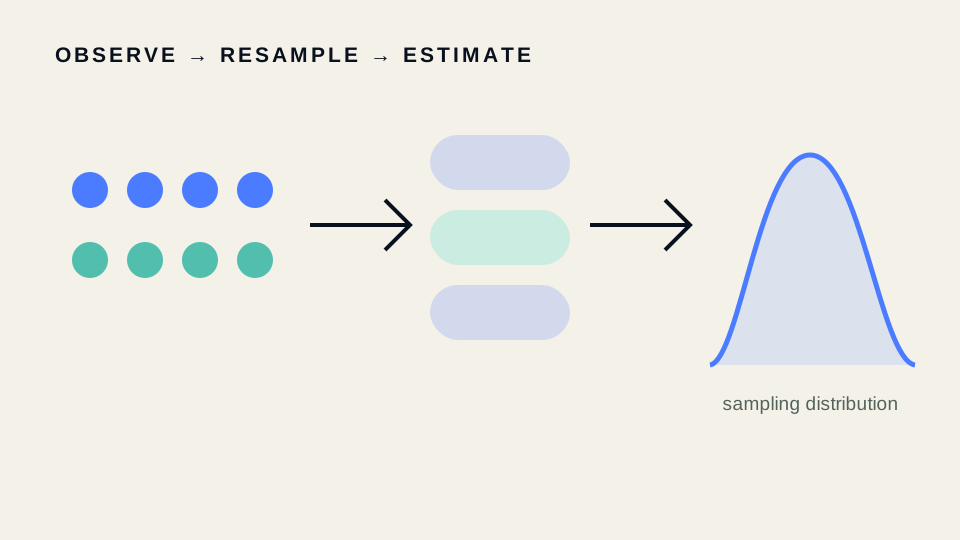
Core idea
Recognise when inclusion, exclusion, survival, or visibility mechanisms distort the analysed sample. The method is useful only when its target, data-generating assumptions, and unit of analysis match the scientific question.
The equation is a compact statement of the target; it is not a substitute for checking design and data quality. State what each observation represents, how it entered the sample, and which sources of dependence remain.
Practical workflow
- Write the scientific question and estimand in one sentence.
- Identify biological units, technical replicates, nesting, repeated measurements, and exclusions.
- Visualise raw observations and group structure before fitting the method.
- Check assumptions using design knowledge, diagnostic plots, and sensitivity analyses.
- Report the estimate, uncertainty, effect magnitude, sample sizes at every level, and limitations.
import numpy as np
from scipy import stats

# Summarise at the independent experimental-unit level.
cell_values = np.array([[2.1, 2.3, 2.2], [2.7, 2.8, 2.6]])
replicate_means = cell_values.mean(axis=1)
print(stats.bootstrap((replicate_means,), np.mean).confidence_interval)
Interpretation and failure modes
Do not read a software output as an automatic scientific conclusion. Ask whether dependence was modeled, whether preprocessing used information from validation data, whether missingness or selection is informative, and whether the reported uncertainty covers every level of sampling. Prefer estimates and intervals to threshold-only language.
Microscopy case study
Excluding dim cells after segmentation can exaggerate mean marker intensity because visibility depends on the outcome.
Connections
Use the tags above to continue to notes on design, assumptions, uncertainty, diagnostics, and complementary methods. A robust analysis normally combines several concepts rather than selecting one test in isolation.
Continue through the concepts
Related notes
Blinding, preregistration, and analysis plansReduce conscious and unconscious analytic flexibility by separating confirmatory decisions from observed results.
MCAR, MAR, and MNAR missing dataIdentify why values are missing before choosing complete-case analysis, imputation, or sensitivity analysis.
Multiple imputationPropagate uncertainty from plausible missing values instead of replacing each missing entry once.
Power analysis: how many independent replicates do you actually need?Statistical power is the probability of detecting a real effect of a given size. Sample-size planning runs that logic backward, before data collection, using a realistic estimate of noise.