Statistical note
Power analysis: how many independent replicates do you actually need?
Statistical power is the probability of detecting a real effect of a given size. Sample-size planning runs that logic backward, before data collection, using a realistic estimate of noise.
A negative result can mean two very different things: the effect genuinely isn’t there, or the study simply didn’t have enough independent replicates to detect it even though it exists. Statistical power is the probability of correctly detecting a real effect of a given size, given the sample size, the noise level, and the significance threshold in use. Power analysis runs that logic backward — before collecting any data — to answer the question that actually matters at the planning stage: how many independent replicates does this study need?
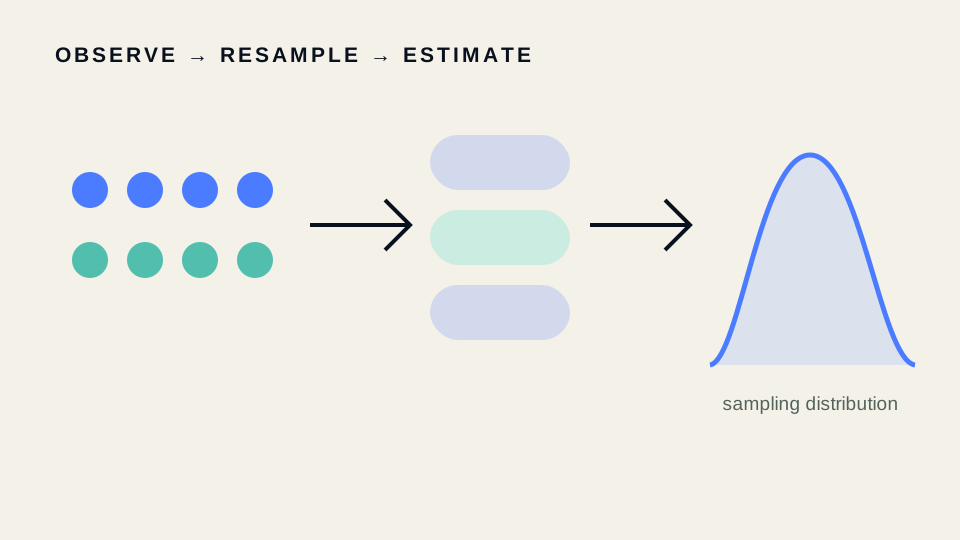
The four quantities that trade off against each other
Sample size, the minimum effect size worth detecting, the noise (variability) in the measurement, and the significance threshold are locked together — fixing three determines the fourth. The commonly quoted approximation for a simple two-group comparison is:
Read qualitatively: required sample size grows with the noise () and shrinks with the square of the effect size you actually care about detecting (). Halving the effect size you want to be able to detect roughly quadruples the required sample size — which is why “detect any effect, however small” is not a usable design target; a specific, scientifically meaningful has to be chosen first.
import numpy as np
from scipy import stats

# Pilot data used only to estimate between-replicate variability, not to test a hypothesis.
pilot_replicate_means = np.array([2.23, 2.77, 2.10, 2.65, 2.35])  # one value per independent culture
sigma = pilot_replicate_means.std(ddof=1)
result = stats.bootstrap((pilot_replicate_means,), np.mean)
print(f"pilot SD across replicates = {sigma:.2f}")
print(result.confidence_interval)
The unit that goes into is the one that matters most
The single most common way power calculations go wrong isn’t the formula — it’s what gets counted as . If a study images 200 cells across 3 independent cultures, for a between-condition comparison is 3, not 200, because the cultures are the independently sampled unit and the cells within each are correlated technical measurements, not independent replicates. Plugging in the cell count instead of the culture count produces a power calculation that looks reassuring and is simply wrong — see pseudoreplication for why this distinction exists in the first place.
Worked example: sizing a follow-up experiment from pilot data
Pilot data exists to estimate (the between-replicate variability), not to test the hypothesis of interest — testing a hypothesis on pilot data and then using the same data to size the confirmatory study double-dips the same small sample. Once a realistic and a scientifically meaningful are chosen (ideally from prior literature or a documented judgement about what magnitude of change matters biologically, not from whatever pilot effect happened to appear), a standard power calculator or statsmodels.stats.power converts them into a required number of independent replicates.
Takeaways
- Power analysis answers “how many independent replicates are needed to detect this specific effect size,” not “how many measurements should I collect” — those are different questions with different units.
- Required sample size scales with the square of how small an effect you want to be able to detect; committing to a specific, scientifically justified effect size is unavoidable before the calculation means anything.
- Use pilot data to estimate variability, not to both discover and then justify the effect size — that reuses the same small sample twice.
- The unit in the sample-size formula must be the independently sampled unit (culture, animal, experiment), not the technical measurement count (cells, frames, pixels) within it.
Continue through the concepts
Related notes
Blinding, preregistration, and analysis plansReduce conscious and unconscious analytic flexibility by separating confirmatory decisions from observed results.
MCAR, MAR, and MNAR missing dataIdentify why values are missing before choosing complete-case analysis, imputation, or sensitivity analysis.
Multiple imputationPropagate uncertainty from plausible missing values instead of replacing each missing entry once.
Pseudoreplication and the experimental unitAvoid treating nested technical observations as independent biological evidence.