Statistical note
ROC AUC and precision–recall curves
Threshold sweeps, ranking performance, average precision, prevalence, and why ROC and PR answer different questions.
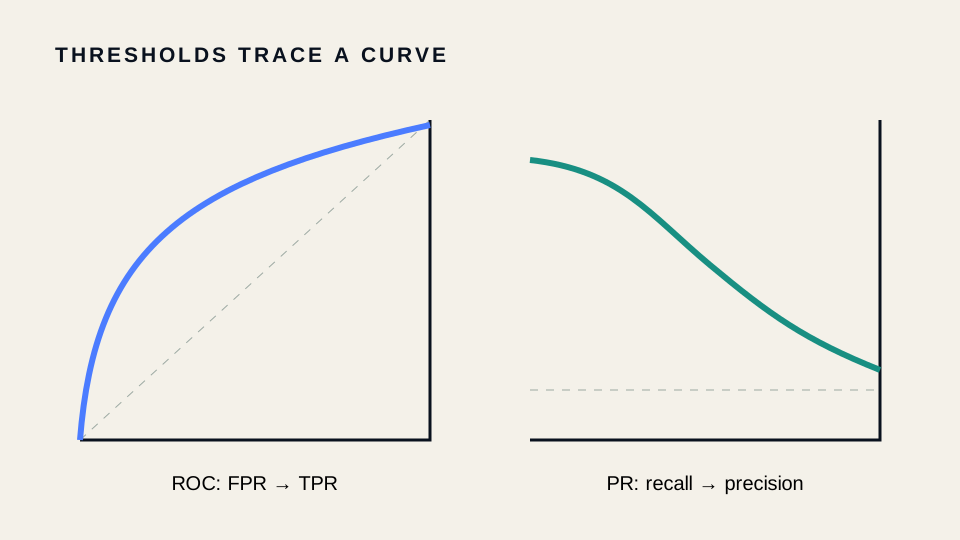
The ROC curve plots true-positive rate against false-positive rate across thresholds. ROC AUC has a ranking interpretation: the probability that a random positive receives a higher score than a random negative, with ties handled conventionally.
The precision–recall curve plots against . Its baseline depends on positive prevalence.
from sklearn.metrics import roc_auc_score, average_precision_score, roc_curve, precision_recall_curve

y_true = [0, 0, 1, 0, 1, 1]
score = [0.05, 0.30, 0.62, 0.41, 0.77, 0.92]
print(roc_auc_score(y_true, score))
print(average_precision_score(y_true, score))
fpr, tpr, roc_thresholds = roc_curve(y_true, score)
precision, recall, pr_thresholds = precision_recall_curve(y_true, score)
Case study: sparse object detection
With very rare particles, a modest false-positive rate can still create many false detections, so PR behavior is often operationally clearer. Neither AUC chooses a deployment threshold. Select thresholds using the cost of misses and false alarms, then report performance on held-out acquisitions.
Functions: sklearn.metrics.roc_auc_score, roc_curve, average_precision_score, and precision_recall_curve.
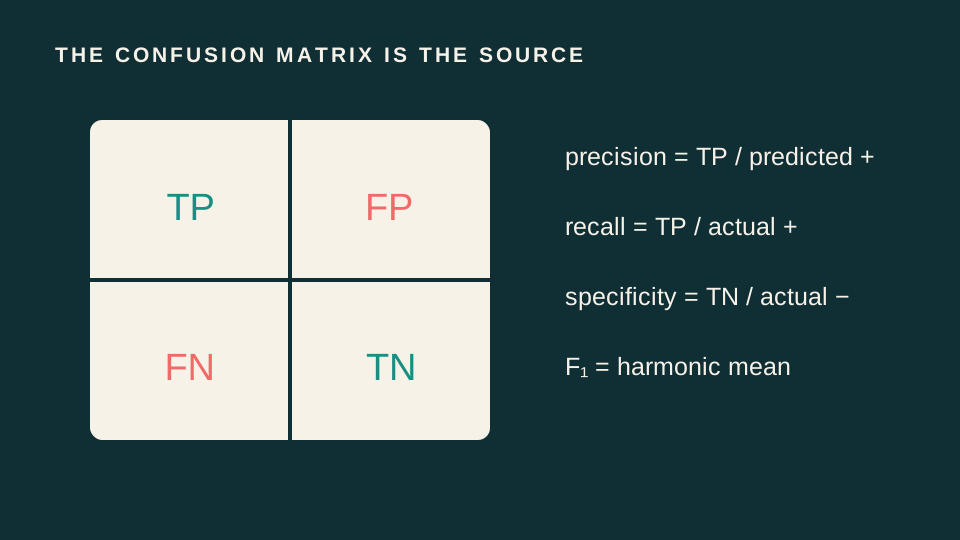
At a chosen threshold, recall is
Continue through the concepts
Related notes
 Average precision
Average precision: theory, interpretation, Python computation, and a scientific-imaging case study.
Classification metrics from the confusion matrixAccuracy, balanced accuracy, precision, recall, specificity, F1, MCC, and choosing metrics under class imbalance.
Accuracy: the simplest classification metric, and its trapWhat accuracy actually measures, why it becomes misleading as classes grow imbalanced, and when it's still the right number to report.
Balanced accuracyBalanced accuracy: theory, interpretation, Python computation, and a scientific-imaging case study.