Statistical note
Accuracy: the simplest classification metric, and its trap
What accuracy actually measures, why it becomes misleading as classes grow imbalanced, and when it's still the right number to report.
Accuracy is the fraction of predictions a classifier got exactly right: correct predictions divided by all predictions. It’s the first metric anyone reaches for because it needs no explanation — but it has one well-known failure mode, and it shows up constantly in scientific imaging, where the class you actually care about (a rare phenotype, a defect, a positive case) is often the minority.
The definition, and where it hides information
Accuracy treats every correct prediction as equally valuable and every mistake as equally costly, regardless of which class it belongs to. That’s a real assumption, not a neutral default.
import numpy as np
from sklearn import metrics

y_true = np.array([0, 1, 1, 0, 1, 0])
y_pred = np.array([0, 1, 0, 0, 1, 1])
print(metrics.accuracy_score(y_true, y_pred))
Why it becomes misleading
If 95% of the images in a screen show no defect, a classifier that predicts “no defect” for every single image scores 95% accuracy while never once detecting the thing being screened for. The number looks excellent and is scientifically useless. This isn’t a hypothetical edge case — it’s the normal situation for rare-event detection in microscopy: rare phenotypes, rare defects, rare positive controls.
The fix isn’t a different formula so much as a different question: accuracy answers “what fraction of predictions were right overall?”, but the scientific question is usually “did the model find the cases I care about, and how often was it wrong when it claimed to?” — that’s precision and recall, not accuracy.
When accuracy is still the right number
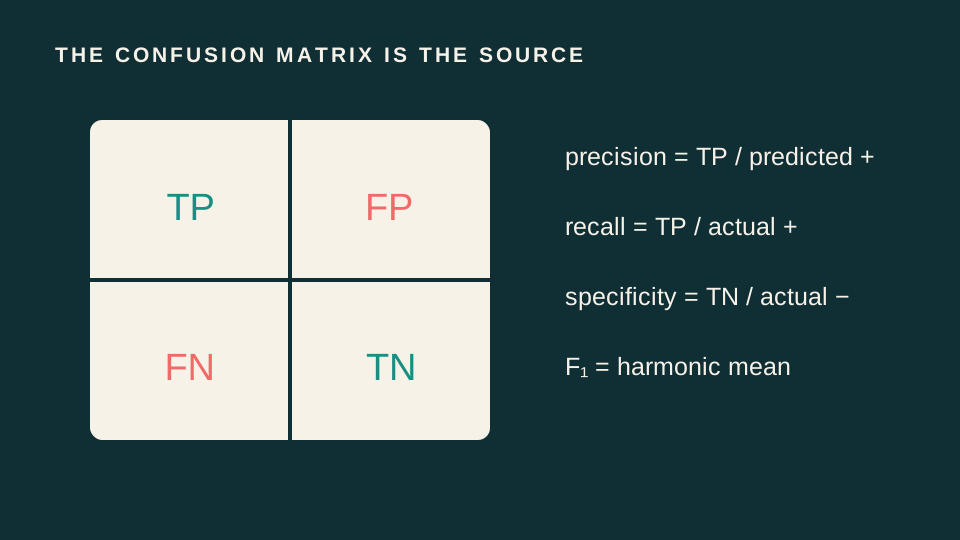
Accuracy is a reasonable headline metric when classes are roughly balanced and every type of mistake carries similar real-world cost — for example, distinguishing two comparably common cell morphologies where a false positive and a false negative are equally undesirable. Even then, report it alongside the confusion matrix, not alone: a single scalar can’t show which class the errors landed on.
For imbalanced problems, balanced accuracy (the average of per-class recall) or the F1 score usually tell the real story that plain accuracy hides.
Takeaways
- Accuracy is easy to compute and easy to misread — it says nothing about which class the errors fall on.
- With imbalanced classes, a high accuracy can be achieved by never predicting the minority class at all. Always check accuracy against the class balance before trusting it.
- Split train/validation/test at the specimen or experiment level, not the image level — otherwise near-duplicate frames from the same specimen leak between splits and inflate every metric, accuracy included.
- Report the confusion matrix alongside accuracy so a reader can see where the errors actually are.
Continue through the concepts
Related notes
Classification metrics from the confusion matrixAccuracy, balanced accuracy, precision, recall, specificity, F1, MCC, and choosing metrics under class imbalance.
Balanced accuracyBalanced accuracy: theory, interpretation, Python computation, and a scientific-imaging case study.
PrecisionPrecision: theory, interpretation, Python computation, and a scientific-imaging case study.
Recall and sensitivityRecall and sensitivity: theory, interpretation, Python computation, and a scientific-imaging case study.