Statistical note
Regression metrics: MAE, RMSE, R², and deviance
Choosing a loss that matches error costs and outcome distributions, from continuous measurements to count predictions.
For residuals ,
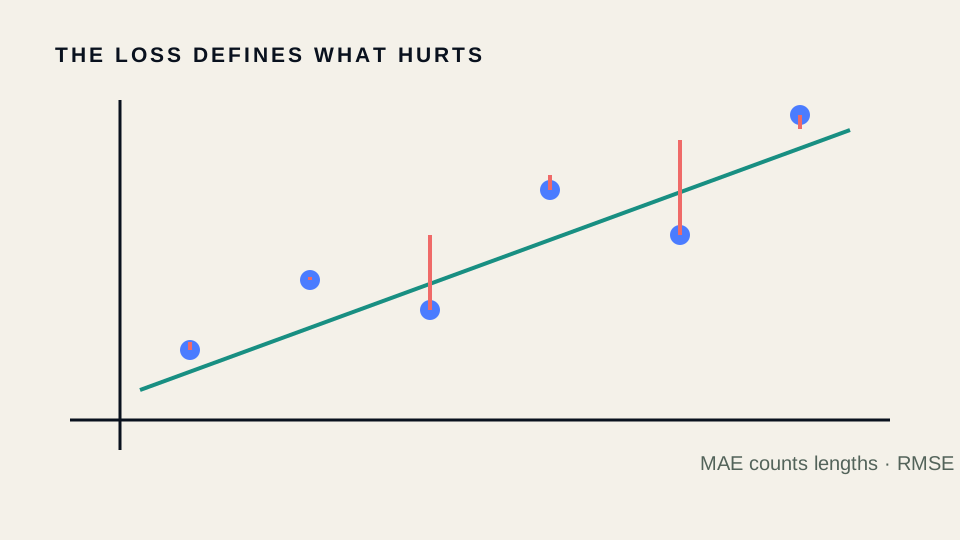
RMSE penalizes large errors more strongly. compares squared error with a mean-prediction baseline and can be negative out of sample.
from sklearn.metrics import (
    mean_absolute_error, root_mean_squared_error, r2_score,
    mean_poisson_deviance,
)

y_true = [3, 5, 9, 12, 20]
y_pred = [4, 4, 8, 15, 18]
print(mean_absolute_error(y_true, y_pred))
print(root_mean_squared_error(y_true, y_pred))
print(r2_score(y_true, y_pred))
print(mean_poisson_deviance(y_true, y_pred))
Case study: density-map counting
For bacteriophage counts, Poisson deviance respects count-like mean–variance structure better than arbitrary percentage error. MAE communicates average count error. Evaluate bias and error versus count magnitude; a single aggregate score can hide systematic undercounting in dense images.
MAPE is unstable near zero. Report multiple complementary metrics and uncertainty across independent test experiments.
Functions: sklearn.metrics.mean_absolute_error, root_mean_squared_error, r2_score, mean_poisson_deviance, and mean_pinball_loss.
Continue through the concepts
Related notes
Mean absolute errorMean absolute error: theory, interpretation, Python computation, and a scientific-imaging case study.
Mean squared errorMean squared error: theory, interpretation, Python computation, and a scientific-imaging case study.
Root mean squared errorRoot mean squared error: theory, interpretation, Python computation, and a scientific-imaging case study.
Mean squared logarithmic errorMean squared logarithmic error: theory, interpretation, Python computation, and a scientific-imaging case study.