Statistical note
Multicollinearity and variance inflation
Understand unstable coefficients caused by strongly correlated predictors and use domain-guided feature reduction.
How does an outcome change with one or more predictors after specifying a defensible mean and error structure? This note turns that question into a practical analysis workflow.
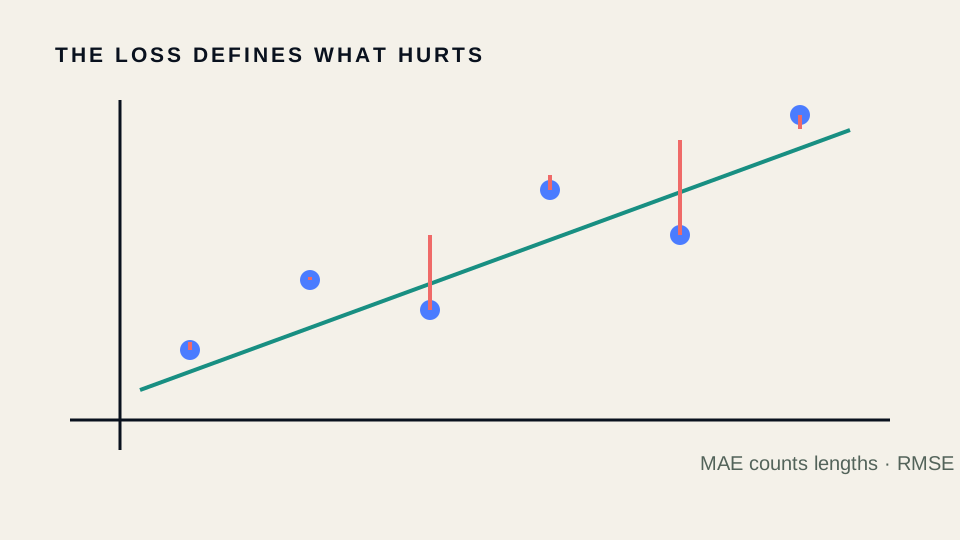
Core idea
Understand unstable coefficients caused by strongly correlated predictors and use domain-guided feature reduction. The method is useful only when its target, data-generating assumptions, and unit of analysis match the scientific question.
The equation is a compact statement of the target; it is not a substitute for checking design and data quality. State what each observation represents, how it entered the sample, and which sources of dependence remain.
Practical workflow
- Write the scientific question and estimand in one sentence.
- Identify biological units, technical replicates, nesting, repeated measurements, and exclusions.
- Visualise raw observations and group structure before fitting the method.
- Check assumptions using design knowledge, diagnostic plots, and sensitivity analyses.
- Report the estimate, uncertainty, effect magnitude, sample sizes at every level, and limitations.
import numpy as np
from sklearn.linear_model import LinearRegression
from sklearn.metrics import mean_absolute_error, r2_score

X = np.array([[1], [2], [3], [4], [5]])
y = np.array([1.2, 1.8, 3.1, 3.9, 5.2])
model = LinearRegression().fit(X, y)
pred = model.predict(X)
print(model.coef_, mean_absolute_error(y, pred), r2_score(y, pred))
Interpretation and failure modes
Do not read a software output as an automatic scientific conclusion. Ask whether dependence was modeled, whether preprocessing used information from validation data, whether missingness or selection is informative, and whether the reported uncertainty covers every level of sampling. Prefer estimates and intervals to threshold-only language.
Microscopy case study
Cell area and perimeter may encode nearly the same size information, making their separate regression coefficients unstable.
Connections
Use the tags above to continue to notes on design, assumptions, uncertainty, diagnostics, and complementary methods. A robust analysis normally combines several concepts rather than selecting one test in isolation.
Continue through the concepts
Related notes
Cross-validation without data leakageEstimate generalisation by keeping preprocessing, tuning, and correlated groups inside correctly separated folds.
Generalized linear models: when your outcome isn't a bell curveOrdinary linear regression assumes continuous, symmetric, constant-variance noise. GLMs swap in a distribution and link function that actually match counts, binary outcomes, or skewed intensities.
Logistic regressionModel binary-outcome probabilities through log odds and interpret coefficients on odds or probability scales.
Mixed-effects models: letting every group have its own baselineHow random effects let a model respect that cells nested in wells nested in experiments aren't independent, without throwing away the structure by averaging it all flat.