Statistical note
Calinski–Harabasz index
Calinski–Harabasz index: theory, interpretation, Python computation, and a scientific-imaging case study.
Clustering metrics either measure internal geometry without references or compare assignments with known labels. Similarity functions define the geometry on which many algorithms depend.
Mathematical definition
The central quantity is
This expression states what is being counted, averaged, ranked, or compared. Its scale and direction must be interpreted in the context of the data and sampling design.
Compute it in Python
import numpy as np
from sklearn import metrics

X = np.array([[0,0], [0,1], [5,5], [5,6], [9,1], [9,2]], dtype=float)
labels = np.array([0, 0, 1, 1, 2, 2])
reference = np.array([1, 1, 0, 0, 2, 2])
print(metrics.calinski_harabasz_score(X, labels))
The function is sklearn.metrics.calinski_harabasz_score. Inspect its current signature and return object in the official documentation for the version installed in your environment.
Interpretation and cautions
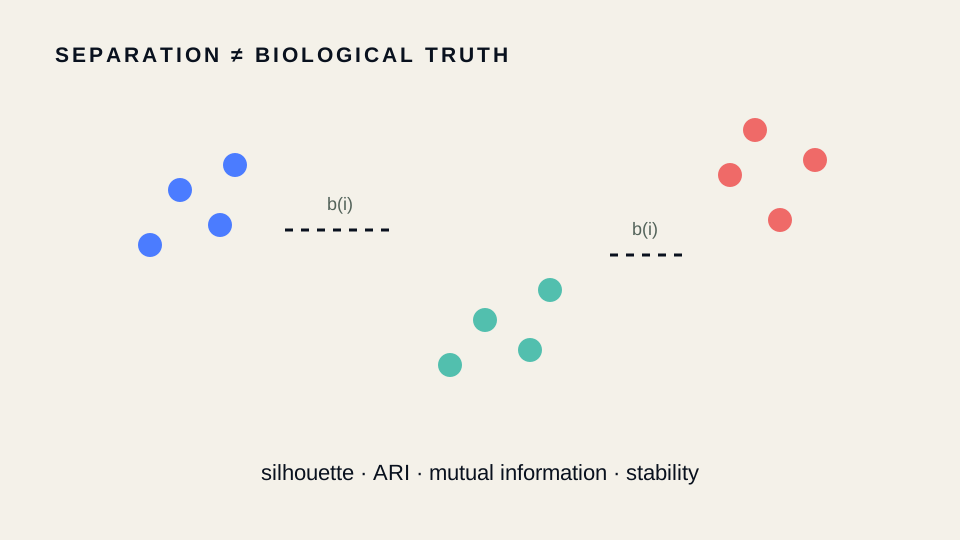
Internal scores encode shape assumptions and cannot prove biological validity. External scores require defensible reference labels. Compare stability across resampling, batches, representations, and cluster counts.
A numerical value is not self-interpreting. Compare it with a baseline, uncertainty interval, operational threshold, or competing model, and retain the underlying observations or confusion counts.
Scientific-imaging case study
For between-cluster versus within-cluster dispersion in phenotype embeddings, inspect cluster stability and independent biological markers rather than optimizing one index alone.
Split train, validation, and test data at the specimen or experimental level. Report variability across independent repeats so that the metric describes generalization rather than leakage.
Continue through the concepts
Related notes
Silhouette coefficientSilhouette coefficient: theory, interpretation, Python computation, and a scientific-imaging case study.
Davies–Bouldin indexDavies–Bouldin index: theory, interpretation, Python computation, and a scientific-imaging case study.
Adjusted Rand indexAdjusted Rand index: theory, interpretation, Python computation, and a scientific-imaging case study.
Adjusted mutual informationAdjusted mutual information: theory, interpretation, Python computation, and a scientific-imaging case study.